A Risk Score is based on the following:
- Risk Scoring Matrix assigned to the project
- The scores entered in the assigned Risk Scoring Matrix (Probability and Impact Diagram grid)
- Risk scoring method selected for the Risk Scoring Matrix (Highest Impact, Average Impact, Average Individual Impact)
- The Risk Probability
- Each risk impact (schedule, cost, quality etc) entered
Risk scoring methods explained:
Highest Impact option selected
The overall impact for a risk is set to the highest of all the impacts.The overall impact is then combined with the Probability to select the Risk Score from the Probability and Impact Diagram grid (Risk Scoring Matrix).
Average Impact option selected
When using Average of Impacts option each risk impact is given a numeric value: Negligible=0, VL=1, L=2, M=3, H=4, VH=5). The average of these is used to determine the Overall Impact.E.g. A risk register has 3 Impact Types and 5 impact values (VL, L, M, H and VH). A risk is assessed as follows:
Cost impact = L
Schedule impact = M
Safety impact = VH
Average numerical impact = (2 + 3 + 5) / 3 = 3.33
3.33 rounds to a value of 3.
The overall impact is then combined with the Probability to select the risk Risk Score from the Probability and Impact Diagram grid (Risk Scoring Matrix).
Average Individual Impact option selected
When using Average Individual Impact each impact type is combined with the Probability to select a Score from the Probability and Impact Diagram grid (Risk Scoring Matrix). The Risk Score is then average of all these scores.The overall impact is determined by choosing the row that refers to the risk Probability in the Probability and Impact Diagram grid (Risk Scoring Matrix) and choosing the cell in that row that is closest to the Risk Score.
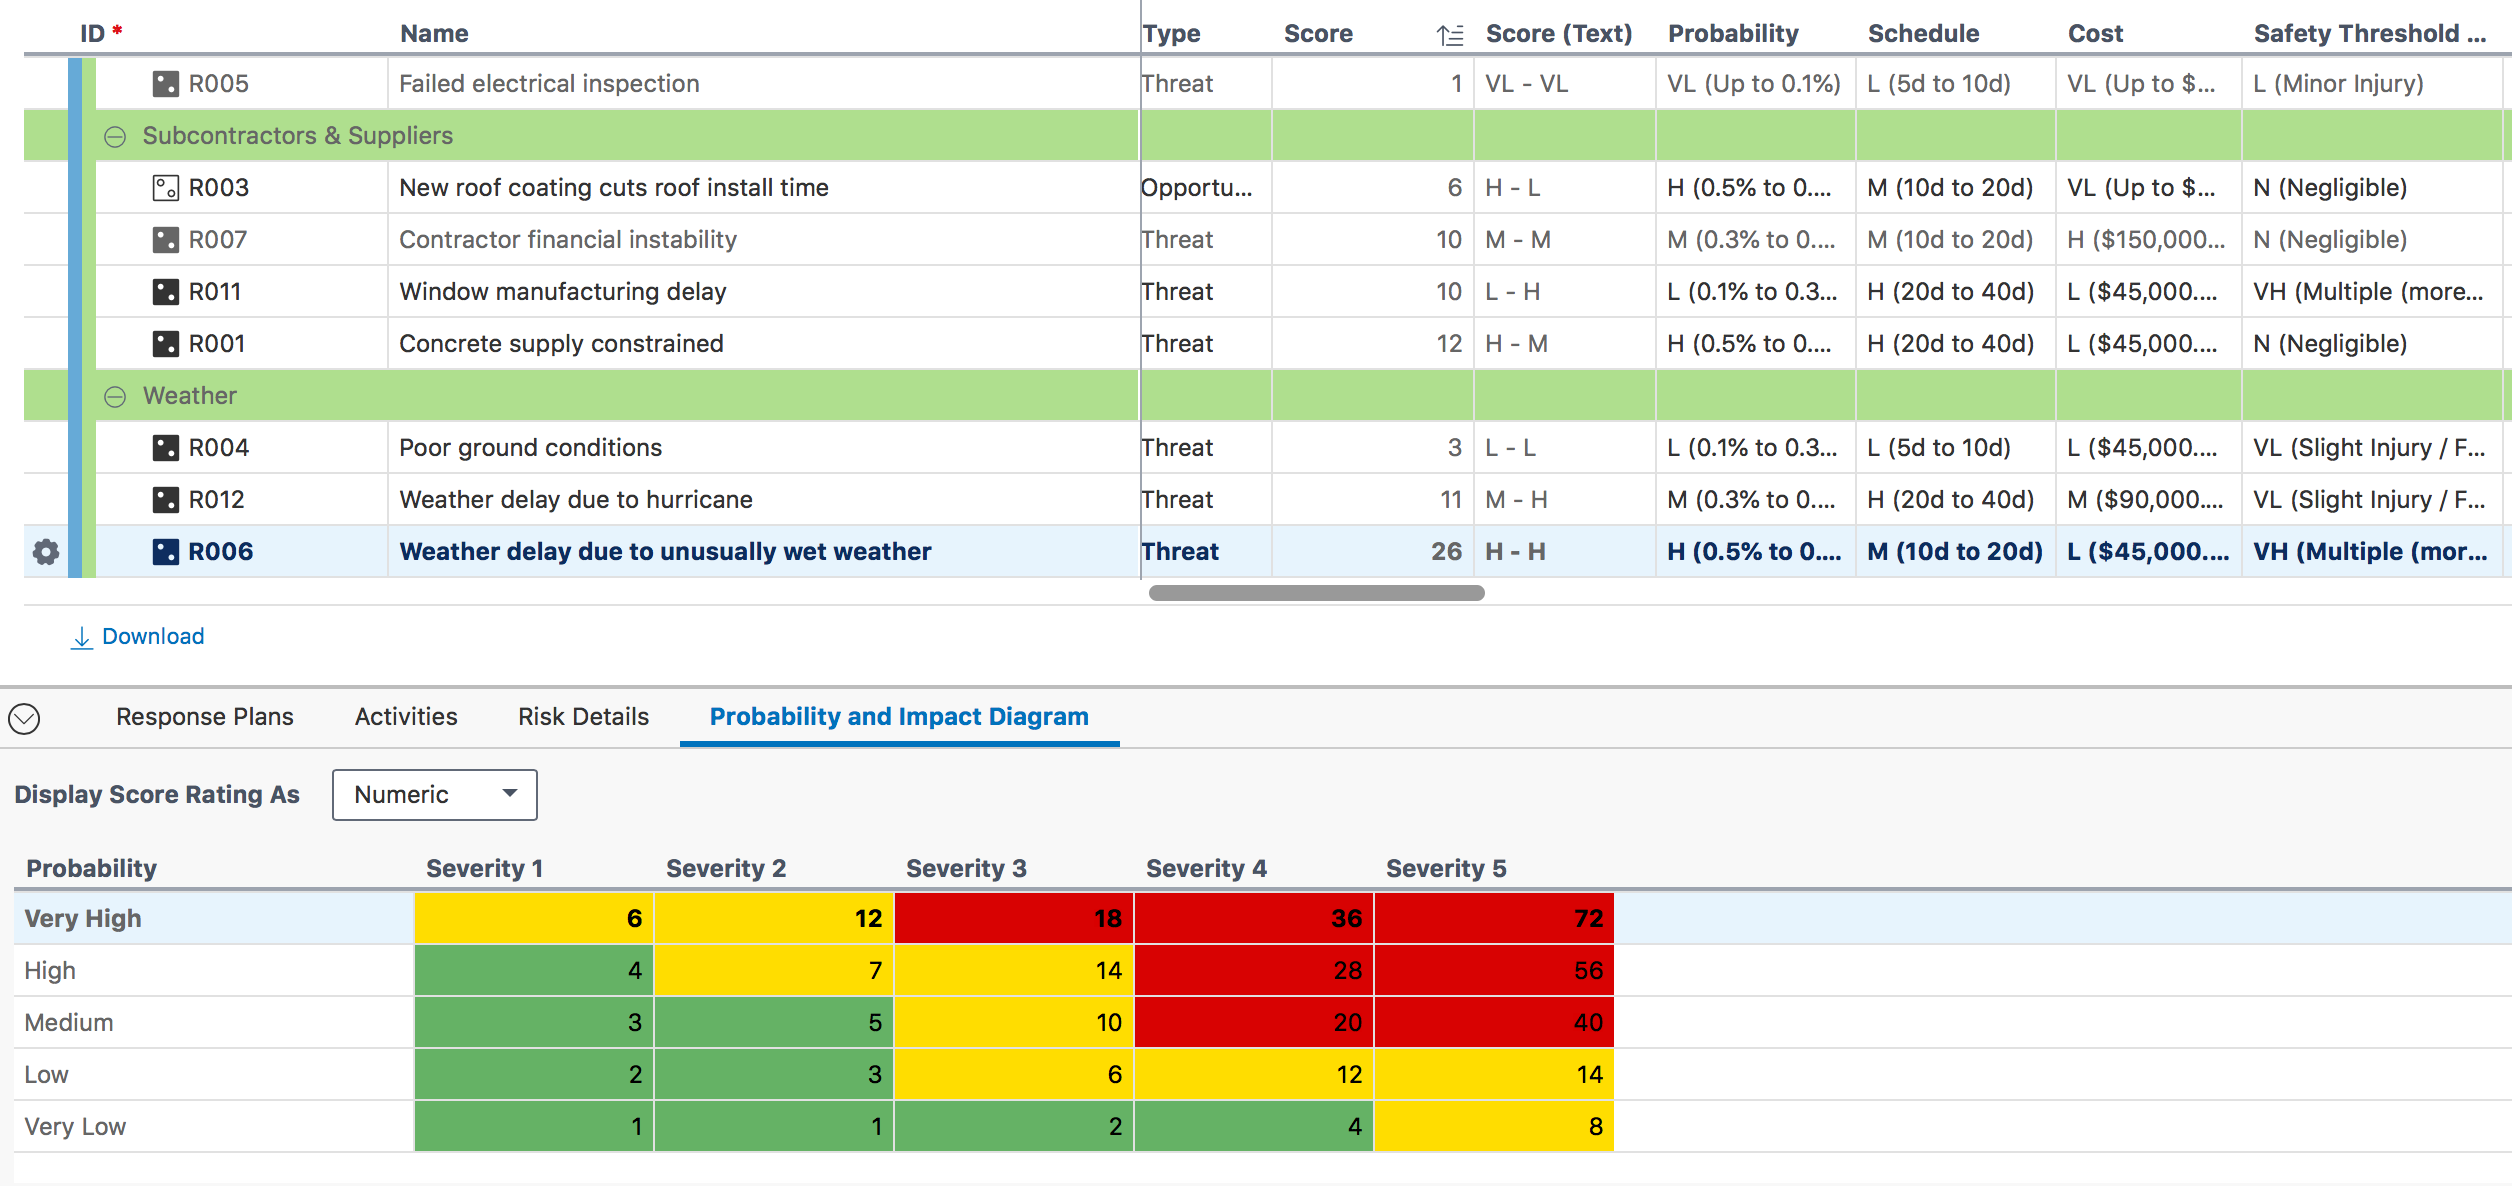
E.g. A Risk has been assessed as follows: Probability = H, Cost = L, Schedule = M and Safety = VH.
Risk scores from Risk Scoring Matrix (see in the screenshot below):
Referencing the Risk Scoring Matrix the Cost impact for H and L has a score 7
Referencing the Risk Scoring Matrix the Schedule impact for H and M has a score 14
Referencing the Risk Scoring Matrix the Safety impact for H and VH has a score 56
Average impact score = (7 + 14 + 56 ) / 3 = 26